1 概要
現在に至るまで、様々な臨床研究に関する論文が発表されてきました。しかし、統計の適用、分析、解釈、報告、研究デザインに誤りがある論文が散見されています。多くの誤りは、高度な統計手法ではなく、基本的な統計処理にあります。本稿は、2013年に公開された「Basic Statistical Reporting for Articles Published in Biomedical Journals: The “Statistical Analyses and Methods in the Published Literature” or “The SAMPL Guidelines”」の内容に基づき、臨床試験の統計関連業務に携わる全ての方に向けて統計報告の仕方のヒントをまとめます。
2 数値と記述統計の報告
本稿では、「Basic Statistical Reporting for Articles Published in Biomedical Journals: The “Statistical Analyses and Methods in the Published Literature” or “The SAMPL Guidelines”」の「数値と記述統計の報告 (Reporting numbers and descriptive statistics)」についてまとめます。
2.1 記載内容
「Basic Statistical Reporting for Articles Published in Biomedical Journals: The “Statistical Analyses and Methods in the Published Literature” or “The SAMPL Guidelines”」には数値と記述統計の報告について以下のような記述がなされています。
| Report numbers—especially measurements—with an appropriate degree of precision. For ease of comprehension and simplicity, round to a reasonable extent. For example, mean age can often be rounded to the nearest year without compromising either the clinical or the statistical analysis. If the smallest meaningful difference on a scale is 5 points, scores can be reported as whole numbers; decimals are not necessary. | 測定値は、適切な精度で報告する。理解しやすくするため、また簡略化するために、合理的な範囲で丸める。例えば、平均年齢は、臨床的にも統計学的にも1年未満に丸めることができる。尺度の最小の差が5点である場合、点数は整数で報告することができ、小数点以下は不要である。 |
|---|---|
| Report total sample and group sizes for each analysis. | 各解析の総標本数およびグループサイズを報告する。 |
| Report numerators and denominators for all percentages. | すべてのパーセンテージの分子と分母を報告する。 |
| Summarize data that are approximately normally distributed with means and standard deviations (SD). Use the form: mean (SD), not mean ± SD. | 正規分布に近いデータは、平均値と標準偏差 (SD) でまとめる。平均±SDではなく、平均 (SD) の形式を使用する。 |
| Summarize data that are not normally distributed with medians and interpercentile ranges, ranges, or both. Report the upper and lower boundaries of interpercentile ranges and the minimum and maximum values of ranges, not just the size of the range. | 正規分布に属さないデータは、中央値およびパーセンタイル範囲、範囲、またはその両方を使用して要約する。範囲の大きさだけでなく、インターパーセンタイル範囲の上限と下限、範囲の最小値と最大値も報告する。 |
| Do NOT use the standard error of the mean (SE) to indicate the variability of a data set. Use standard deviations, inter-percentile ranges, or ranges instead. (The SE is an inferential statistic—it is about a 68% confidence interval—not a descriptive statistic.) | データセットのばらつきを示すために、平均の標準誤差 (SE) を使用しない。代わりに、標準偏差、パーセンタイル間範囲、範囲を使用する (SEは推論統計量であり、68%の信頼区間であり、記述統計量ではない)。 |
| Display data in tables or figures. Tables present exact values, and figures provide an overall assessment of the data.[42,43] | データを表や図にする。表は正確な値を表示し、図はデータの全体的な評価を提供するものである。 |
2.2 記述統計を記載する際の留意事項
3.1に注意すべきポイントをまとめましたが、いかがでしたでしょうか?SEを使用しないことは意外と感じた方も多いかもしれません。これは推定量を算出する時に使用しましょう。例えばANCOVAの群間差などがあてはまります。
●SEについて
SEとは、標本平均の値が母平均に対してどの程度ばらついているかを表すものです。このため、SDのように標本データのばらつきを表す意味はないため、データセットのばらつきを表すためにSEを使用することは不適切となります。
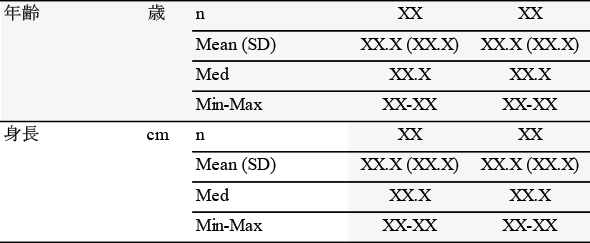
3 記載例
4 参考文献
- Lang TA, Krishan A, Altman DA. Basic Statistical Reporting for Articles Published in Biomedical Journals: The “Statistical Analyses and Methods in the Published Literature” or “The SAMPL Guidelines”. The EASE Science Editors’ Handbook. 2013: 1-8.
(https://www.equator-network.org/wp-content/uploads/2013/03/SAMPL-Guidelines-3-13-13.pdf)
ヒト臨床試験 (ヒト試験) で得られる結果は、様々な誤差を含んでいます。この誤差を小さくすることで介入効果を増大させることができます。オルトメディコは、多分野の専門家を有するため、様々なアプローチにより誤差を最小化する試験運営が可能です。引き続き、皆様にご満足いただけるような高品質なヒト試験を提供させていただきますので、今後ともどうぞ宜しくお願い申し上げます。
- ★問い合わせ★
-
-
①臨床試験のお見積りに関するお問い合わせ
HP: https://orthomedico.jp/contact.html
Mail: info@orthomedico.jp -
②臨床試験に参加したい方はコチラ
HP: https://www.go106.jp/ -
③機能性表示食品の届け出に関するお問い合わせ
HP: https://届出.com/
Mail: planning-department@orthomedico.jp -
④栄養計算に関するお問い合わせ
HP: https://www.cand.life/
Mail: info@CAND.life -
⑤研究会の開催に関するお問い合わせ
HP: https://はじめての研究会.jp/
Mail: info@hajiken.jp
-
①臨床試験のお見積りに関するお問い合わせ